We often face the problem of working within the limits of the UTM zone, having a lot of problems (Spanish Idiom: “ver a palitos” to have a problem of difficult solving) because the coordinates do not work there.
The reason of the problem
Some time ago I explained how the UTM, coordinates operate, here I will only focus on the problem. The following chart shows how in Costa Rica, Honduras and Nicaragua exists a change between 16th and 17th zones; this implies that areas involving these coordinates, marked in white circles, are repeated. A point taken in the Honduran Mosquitia, if it is not said to be in the 17th area would fall in Guatemala in the 16th area, while the one which is on the Atlantic Nicaraguan coast would fall in the Pacific Ocean, as would happen with one in the Caño island in Costa Rica.

This is because the UTM grid takes a central Meridian with an x coordinate of 500,000 and from there it follows until you reach the limit zone. In this way they will never have negative values. But therefore, coordinates are not unique; they are repeated in each area and each hemisphere.
How to solve it
I will use this example now using Microstation Geographics now known as Bentley Map; it should be similar with AutoCAD: I want to georeference an image, taking the four coordinates of its corners. In UTM is impossible, since entering the points, two will fall in Guatemala.
1. Convert UTM to geographical coordinates. This can be done with any program that goes there, certain time ago I presented an Excel spreadsheet that does these tasks. As a result we will have this:
-85.1419, 16.2190
-83.0558, 16.1965
 -83.0786, 14.2661
-85.1649, 14.2885
2. Change the coordinate system in MicroStation. This is so that we can enter the points in that format.
It’s made with: Tools >coordinate systems > master
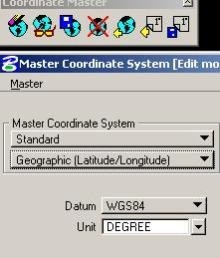
Here we select the first icon (edit master) and indicate that the coordinate system must be geographic. Always keeping the WGS84 Datum
3. Enter the coordinates. This task is done via keyin, as there are few points; so first we activate the command point, then from the keyin we write:
 xy=-85.1419,16.2190
doing the same for the others:
- xy=-83.0558,16.1965, enter
- xy=-83.0786,14.2661, enter
 xy=-85.1649,14.2885, enter
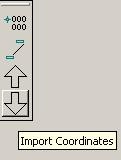
If you don’t want to have problems (Spanish idiom: quieren quebrar el coco) you can save this data in a txt file and import it with the command that is made for that.
Geo-referencing the image.
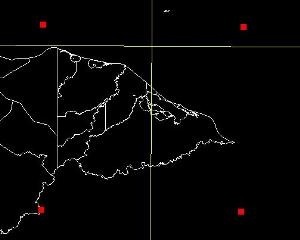
The result of entering the points is there on both sides of the boundary zone.
Now we just load the image. This is done from the raster manager, indicating that the image will be loaded interactively and specifying the left upper point and then the lower right one.
Here it is:

What happens to the parcels?
Something similar would happen with the lots that are split by the boundary zone, what is done is to convert to geographical the vertexes in order to have a single deployment. An ideal solution in the area is to lift points setting the GPS to capture geographical coordinates.
 Autocad Software, Bentley Microstation, Gis Google Earth, Gis System Geomate Provides Services For Complete Gis Software And Solutions, Autocad Software, Autocad Courses, Bentley Microstation, Microstation Software, Gis Google Earth, Open Source Gis And More.