TRANSLATION NOTES: Please read some comments at the end of this post.
In order to don’t lose impulse, more than because of the Alzheimer that occasionally betrays us, here I leave some of the free consultancy I was giving to some guys from Mexico; who maintains their decision of using Geographics.
1. The data

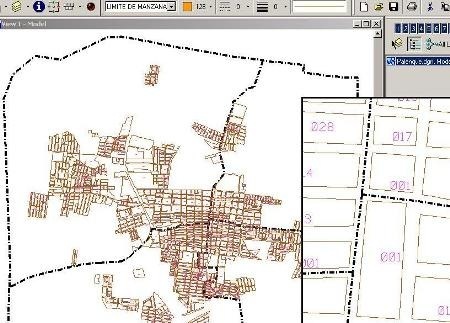
There is a map, which contains four sectors, and then each block has boundaries and centroids. The centroid has link to the database, to the blocks table, and also contains the sector’s name in the Cve_Sec column.
So in this case, I want to theme the blocks, based on the number of sector. I will explain this topic first, since it was necessary because the link was from the centroids and not from the shapes.
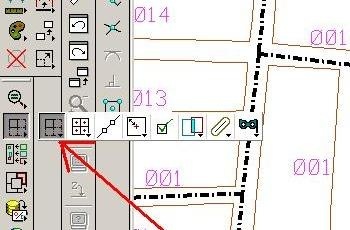
- Create shapes. If not visible, activate the Geographics toolbar, on the Tools> Geographics> Geographics menu. To generate the shapes, turn off all levels, leaving only the block level and centroids, then generate a fence and choose the icon labeled Create shapes.

It is required a free level where to store the shapes.
- Move links to the shapes. To do this, laid block boundary level, and only let shapes and centroids level. Make a fence and select the fourth icon named Associate Linkages indicating Centroid – > Shape and then clicking on the screen.
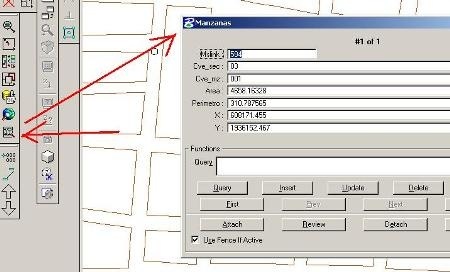
- Review links. The signal that all is well occurs when, if we use the Review Attributes command, data from the centroid is raised.

2. How to do theming
For doing theming, select Data base> Thematic resimbolization.

It appears a window in which you need to configure the work: at the right if we want only a visual theming or want to save it in a map layer. This is also done if we want a theming of the entire file, or from a Fence. Then, from the buttons on the left we use Add, if we wish to make inquiries via specific queries.
Select the Auto button to indicate that we hope the program will automatically search categories. There select the blocks table, and Cve_sec column and indicate that the classes will be unique; also the filling, color and level base in which is placed each layer. After doing Ok, we can again choose another color, as those shows are a bit ugly.

And that’s all, note that when we show Go and apply click on the screen, the blocks are themed based on the sectors.

3. How to place the legend
For this, make Settings> Legend, and choose from the panel the two points’ option or set the size in the measure unit that we are working, in this case I will use 100 x 100 meters.

With Bentley Map, it’s done in another way(*), but much more kind.
TRANSLATION NOTES:
(*) es otra onda. It’s a colloquial phrase which means done in other way.
 Autocad Software, Bentley Microstation, Gis Google Earth, Gis System Geomate Provides Services For Complete Gis Software And Solutions, Autocad Software, Autocad Courses, Bentley Microstation, Microstation Software, Gis Google Earth, Open Source Gis And More.