Google Earth beyond being a tool for general entertainment has also become a visual support for mapping, both to show results as to review if work done is consistent; it also serves as a teaching tool for geography or geodesy classes.

In this case I’m going to get assisted by Manifold GIS to build the quadrants and by Google Earth to go checking results, using an exercise jointly developed with Cristian Mejia, a surveyor of Sucre with whose help experience was altogether. First we need to define an area on which we will work, in this case Bolivia which is among areas 19, 20 and 21, and 8 and 24 degrees latitude in the southern hemisphere. All this can be drawn from Google Earth with a simple inspection, changing the option to view it in UTM to display zones and in geographical coordinates’ to see latitudes and longitudes.
 1. The quadrant of the three areas of interest.
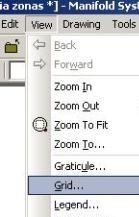
In Manifold this task is done with View> Grid
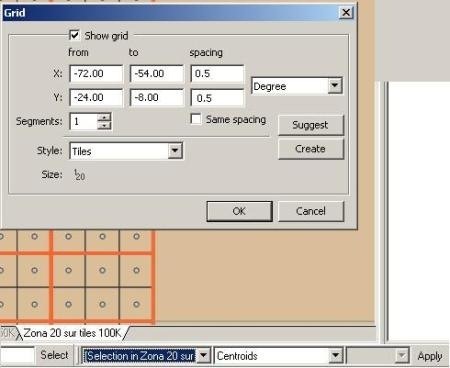
Then we indicate that we expect a quadrant that goes from length – 54 to – 72, these are negative for being in the Western hemisphere. And select latitude from – 8 to – 24, these values are also negative because are placed below the equator.
We also indicate how we want to divide it, the whole dimension is 18 (3 zones of 6 degrees) in length and 16 (2 times 8 degrees) in latitude. We specify to create tiles rather than simple lines. And there we have the three zones, as is shown up on Google Earth. To test, we right-click the layer and export to kml, becoming so logical this visual sense instead of what in a Geodesy laboratory 20 years ago had difficulty in understanding.

2. The 1: 250,000 maps
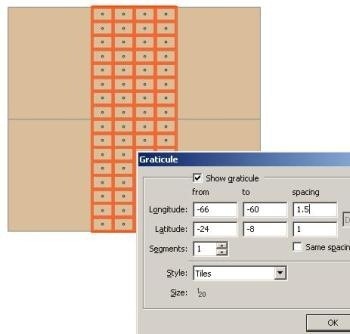
For example, we will work zone 20 in the same way. In this case, the 1:250,000 sheets have a dimension of 1.5 x 1 degree, equivalent to dividing the whole area in a matrix of 16 x 4 tiles.

Now we just specify that we want the grid which is between longitudes 60 and 66 and latitude 8 and 24, which implies that 6 degrees will be divided into segments of 1.5 and in segments of 1 degree latitude.
Done: to check, right click and export to kml. In lat/long view can be checked if lines are consistent with the Google Earth grid.
 To add centroids it will be selected all the tiles, and applied geoprocessing function, as shown in the chart below. No need to do another layer, because Manifold supports different types of object on it, if you want to send another, it’s not necessary to select them as are created with active selection so that is only needed to make cut / paste.
3. The 1: 100,000 maps
In this case, nothing more than the spacing changes, 1.5 degrees are divided into three segments, that’s why are from 0.50 x 0.50.

4. The 1: 50,000 maps
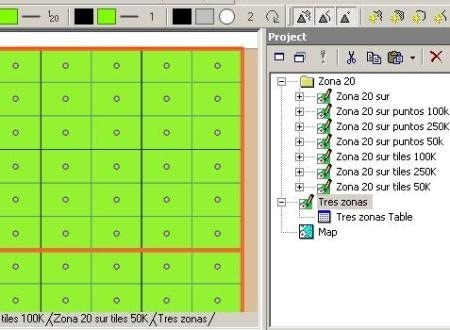
It is worth saying that the next layer is divided into segments of 0.25 x 0.166667, because we are splitting it in 2 x 3 matrix, as shown in the final result. On the right layers are shown into a folder and down them within a map, as we explained it one day.

And this is how it would be in Google Earth, but we could do it all at once, with the entire area, however it is not appropriate because we are going to require turn it to UTM and this is done with separated layers by zone.

It is curious that Manifold .map file that contains all the layers, measures only 85 kb and Google Earth’s one, 59 kb.
In short, do this without Google Earth would have required more abstract testing time and doubt of a possible error. Google images will not be as accurate, but as a pedagogical tool can be of great utility to the extent that its versatility has led the conventional spheres slightly less than office decorations.
 Autocad Software, Bentley Microstation, Gis Google Earth, Gis System Geomate Provides Services For Complete Gis Software And Solutions, Autocad Software, Autocad Courses, Bentley Microstation, Microstation Software, Gis Google Earth, Open Source Gis And More.