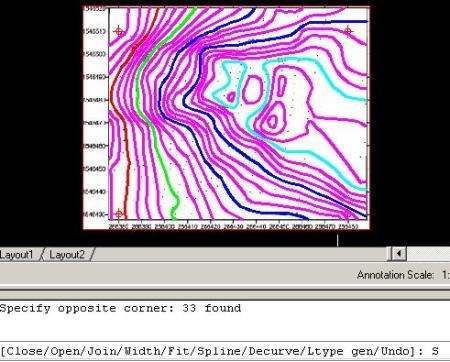
In the previous post we had georeferenced an image that contains contours; now we want to turn it to Civil 3D contours.
Converting image curves to digital mode
For this there are programs that virtually automate the process like AutoDesk Raster Design, equivalent to Bentleys Descartes or ESRI’s Arcscan. In this case I’ll do it manually, drawing polylines.
Smartlines should not be used for this task, but normal polylines.
It is recommended to create levels with the names of the principal curves. It’s a help for visual aspects.
It is preferable to work with thickness of 0.30 for lines in order to display the progress.
The LWT button must be enabled to see the thickness of lines.

Smoothing and joining curves.
This process is not always necessary but, for educational purposes let see how it is done. Happens that some polylines could not be connected because the command was interrupted, or we made some vertexes so fast, that they do not behave well with the curve.
- Activate the polyline edit command pedit
- Select multiple choice, with the M letter and then press enter
- Select all the polylines that we hope to work
- Use J to join
- Use S to soften

Assigning elevation to polylines
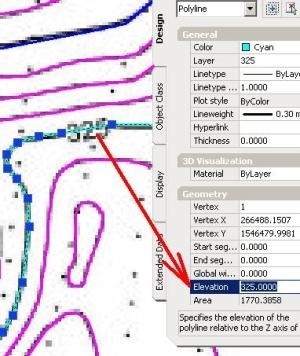
We have to touch the curves, one by one, enabling properties and assigning the corresponding elevation. In this case, as curves are each 25 centimeters; the green curve would be 322, and the following ones to reach the blue would be 322.25, 322.50, and 322.75
 In the case of the light blue ones, note that it occupies some criteria to determine how the zone’s behavior is. That’s why the principals must be put in different color.
You can verify that all were left with elevation, looking an isometric view.
View > 3D Views > NE Isometric.
Convert polylines to contours.
To do this, we go to the left panel, in the Prospector tab, and create a new surface TIN type.
Here, once created the surface, we can view properties, among which appear Masks, Watersheds, and Definitions. Here’s where the criteria for Contours appears.
Make right-click button on Contours, then choose Add.
In the description we will put scanned curves, and then we do ok. After this, we select all the polylines that we have digitized.
Look how from there, the triangulation is generated.
Adjust the curves properties.
It is left a detail that causes despair when done for the first time. It is that contour lines seem that they are not visible, but is a matter of deployment properties.
For this, apply the right mouse button and select Edit style surface. In this panel, choose the Contours tab. In Contour Intervals, we choose the same interval which has been used in the scanned map to check if everything went well.
The main curves are drawn every 1.00 and secondary each 0.25.

And there it is. It is clear that it can be made a treatment at the extremes, because the program tries to close the boundary assuming no continuity with another sheet. We’ll see if in another post we compare this with data from Google Earth and promote the tourist destination of our Pipiles’ friends.

 Autocad Software, Bentley Microstation, Gis Google Earth, Gis System Geomate Provides Services For Complete Gis Software And Solutions, Autocad Software, Autocad Courses, Bentley Microstation, Microstation Software, Gis Google Earth, Open Source Gis And More.