Some time ago, the digitizing tables were the output for vectorizing print maps; then the scanner arrived to the office, although the task does not just apply to scanned maps, but for others that were converted to image or pdf and for the ones which we don’t have vector format.
The procedure that I am going to show will use Descartes MicroStation, but the same can be done with any other program: AutoDesk Raster Design (before CAD Overlay), ArcScan, Manifold GIS (Business Tools), remember that for a long time I did it with Corel Draw.
1. The image
There are some factors that make possible the vectorization without minor headaches. Among these are: the image format, a png or tiff will give better results, while a jpg is almost impossible; also affects resolution that was chosen when it was exported, because if it was converted from printing or export module, normally, this would have a scale associated to paper’s size; the larger paper’s size, the better resolution could be expected or at least better conditions than a simple screen print.
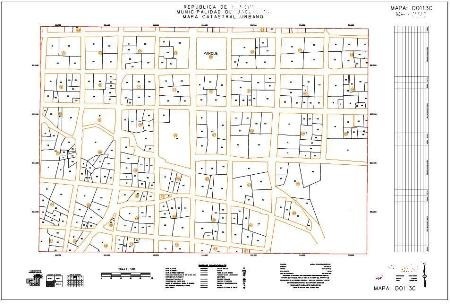
The example I will use is a cadastral map at scale 1:1,000 that was exported from Microstation printing module, to a sheet of 24″ x 36″, in .tiff format.
2. The georeference
A map like this is easy to georeference, because coordinates are in the margin. I have drawn points using the “place point” command, and entering in the keyin the coordinate in the “xy = coordinate X, coordinate Y” form, these are the points in blue in the image below.
Then I called the reference image, placing it slightly outside of those points. After this I put the same points in different colors, intersecting with the green lines and always using an exaggerated thickness to make them visible. Finally, using “edit, warp” from the raster manager, I have applied the four control points as shown in the figure. Now this should be able to be vectorized at scale.
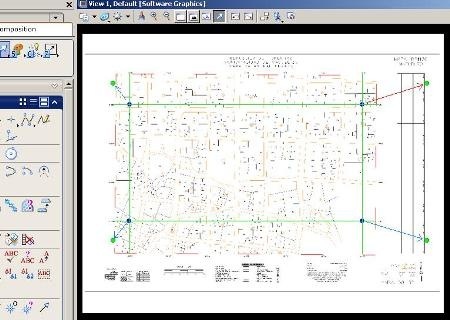
Although MicroStation V8i supports calling a pdf as an image file, and this can be georeferenced with the previous procedure, the vectorization process does not apply because it requires having write rights. It will need to load it and save it as an image (right-click, save as…).
 3. Vectorization
I am using Microstation Descartes V8i, although this tool works equally in older versions.
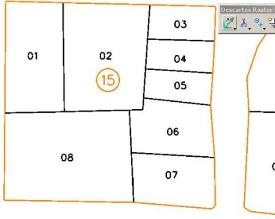 Enable Descartes tools. For this we do “tools, raster, descartes raster edit” and that deployed us a toolbar that contains the basic tools for image processing.
Let’s do the exercise in the block 15 to explain the scribbles we have to do:
Select the mask. The first icon allows you to create masks based on criteria; in this case I will use the colors, indicating that I want to add the orange color to the mask. We must approach to the center of the line, and select a table in the area where color looks flat. To set the color you want to display the mask, it must be made with the “color mask dialog” option. In my case I chose green color. You can also create various masks and save the settings in the .msk format.
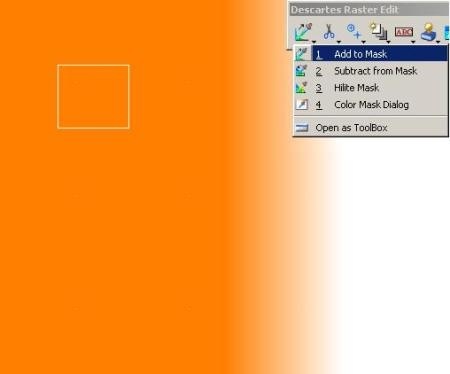
 Immediately everything selected in the mask switches to the specified color (green). You can also add more colors to the same mask, or remove them.
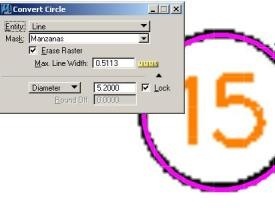
Vectorize circles. We shall construct the circles seen in the blocks’ numbering; for this it’s requested a radio and then we just have to touch the line of each of the circles. Quite simple, I used a magenta color and sufficient thickness for visual issues. It must be specified a maximum line width, this is done by measuring a distance that exceeds the line width in the image. For a best control it is adequate to go deleting the vectorized part of the image.
Standardization. To prevent creating more vertexes because of the pixeling, it is assigned a normalization factor. The example is not normalized; see how lines are affected by the pixeling.
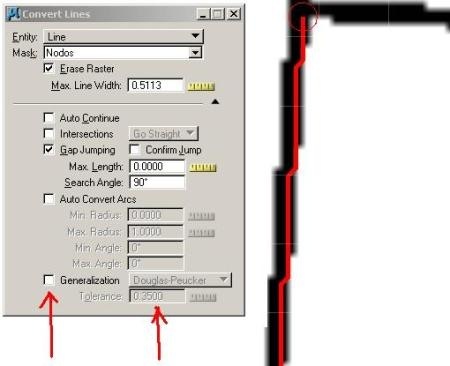
Vectorize boundaries with topology. Now I want to digitize the boundaries, if I create a mask separately to block boundaries I would have the problem of not having topological cleaning in the internal boundary nodes. To do so I add orange and black colors to the mask, then I play the vectors separately. The signal is that all will be placed in the color of the mask, and then they just touch using the “convert lines”
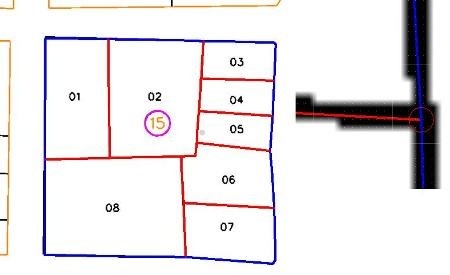
Simple, that’s it. Look at the enlarged detail, where the nodes have been recognized maintaining topological match at the vertexes, nodes can be stored as a file with .nod format. It can be chosen to change the color or select the desired level when you want to; this is what I’ve done to separate the boundary block from the property even working with a single mask.
Convert text. For this there are other tools that allow selecting text horizontally, rotated, multiple, among others by applying OCR. Right there is the option to convert blocks (cells).
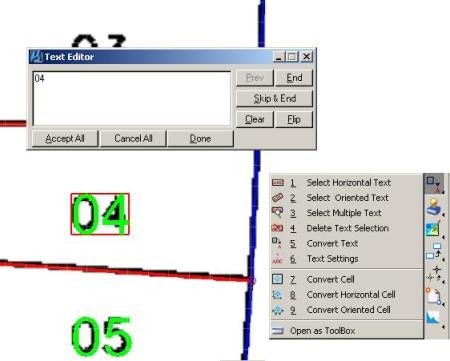
Other options for vectors. Once applied the mask, the tasks that you can apply are:
4. Convert individual lines
5. Convert an entire framed in a box
6. Convert all objects connected in the map
7. Build contours, this requires being in a 3D seed file.
8. Building circles
9. Simplify vectors, i.e. for chains lines that have too many segments
The precision. I’ve measured the distance from the front of property 2, and it has given me 28.9611 meters, the original was 29.00, vectorizing it on foot would have given the same answer, but slower, with a digitize table would have been worse. In this precision fact it must be consider several factors including the scan quality, if the blade was not damaged, the scale of the map, the pixel quality and especially the georeferencing of subsection 2 from this post.
Massive vectorization.
If it is given an image in two colors or if you are in a hurry, you can make massive vectorization, although for this it must taken some aspects into account:
- If the map contains only boundaries, once been tested for standardization it could be done very simple
- If the map has texts, it is better to first convert them, then with the image cleaning tools remove its remaining dirty
- If it’s a scan in color, with an acceptable scan, like a 1:50,000 map sheet, it can be done by colors, and making masks with useful names (contour lines, buildings, roads, grid, etc) to implement it uniformly to different images.
- When you have continuous sheets, it is preferable to call them both, make any possible adjustments to get joints and vectorize them, taking selected different sheets.
- It is advisable to do surveillance, especially in the joints and lot of lines nearby areas.
 Autocad Software, Bentley Microstation, Gis Google Earth, Gis System Geomate Provides Services For Complete Gis Software And Solutions, Autocad Software, Autocad Courses, Bentley Microstation, Microstation Software, Gis Google Earth, Open Source Gis And More.